I recently joined Instagram (I’m late, I know).
I joined because my daughter wanted to, because her friends had, to see what it was all about. She is artistic, and we like to talk about things like color combinations and camera angles, so Instagram is a good fit for us. But it’s quickly changing the way I understand photography. I’ve always been able to set up a good shot, and I’ve always had an eye for color. But I’ve never seriously followed up on any of it. It didn’t take long on Instagram to learn that an eye for framing and color is not enough to make for anything more than accidental great shots. The great shots that I see are the ones that pick deeper patterns or unexpected contrasts out of seemingly ordinary surroundings. They don’t simply capture beauty, they capture an unexpected natural order or a surprising contrast, or they tell a story. They make you gasp or they make you wonder. They share a vision, a moment, an insight. They’re like the beginning paragraph of a novel or the sketch outline of a poem. Realizing that, I have learned that capturing the obvious beauty around me is not enough. To find the good shots, I’ll need to leave my comfort zone, to feel or notice differently, to wonder what or who belongs in a space and what or who doesn’t, and why any of it would capture anyone’s interest. It’s not enough to see a door. I have to wonder what’s behind it. To my surprise, Instagram has taught me how to think like a writer again, how to find hidden narratives, how to feel contrast again.

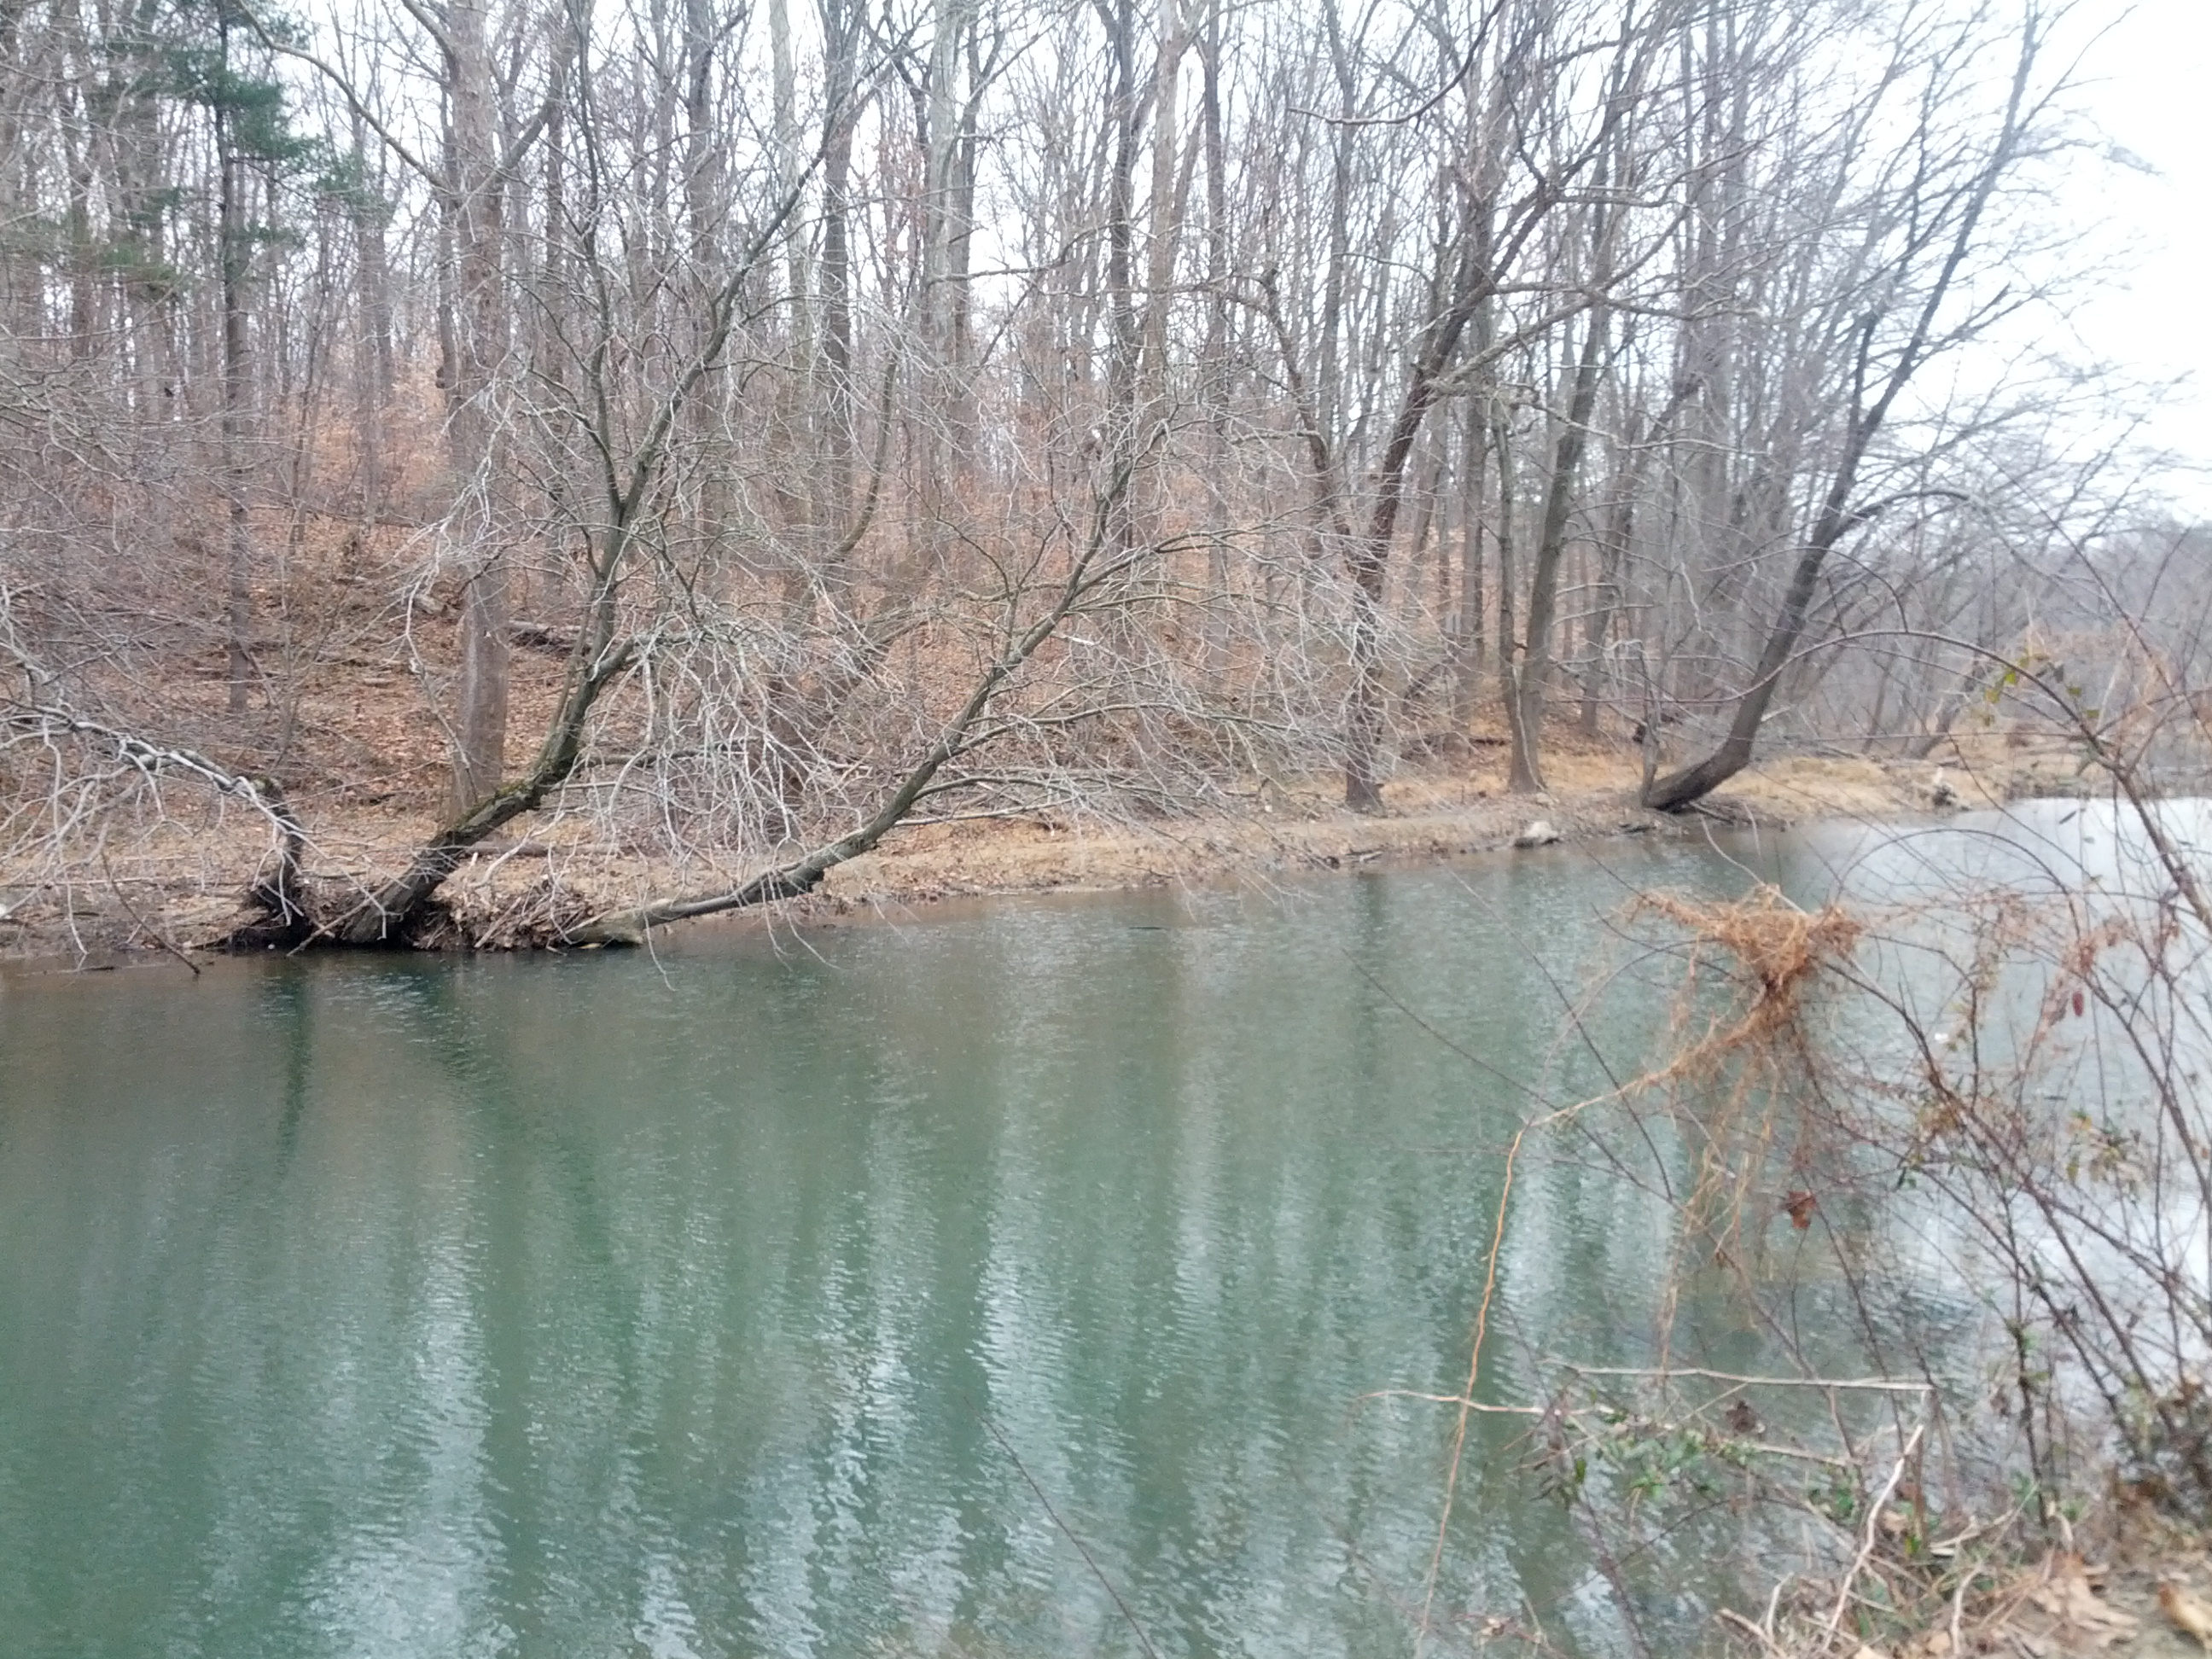
Sure this makes for a pretty picture. But what is unexpected about it? Who belongs in this space? Who doesn’t? What would catch your eye?
This kind of change has a great value, of course, for a social media researcher. The kinds of connections that people forge on social media, the different ways in which people use platforms and the ways in which platforms shape the way we interact with the world around us, both virtual and real, are vitally important elements in the research process. In order to create valid, useful research in social media, the methods and thinking of the researcher have to follow closely with the methods and thinking of the users. If your sensemaking process imitates the sensemaking process of the users, you know that you’re working in the right direction, but if you ignore the behaviors and goals of the users, you have likely missed the point altogether. (For example, if you think of Twitter hashtags simply as an organizational scheme, you’ve missed the strategic, ironic, insightful and often humorous ways in which people use hashtags. Or if you think that hashtags naturally fall into specific patterns, you’re missing their dialogic nature.)
My current research involves the cycle between social media and journalism, and it runs across platforms. I am asking questions like ‘what gets picked up by reporters and why?’ and ‘what is designed for reporters to pick up?’ And some of these questions lead me to examine the differences between funny memes that circulate like wildfire through Twitter leading to trends and a wider stage and the more indepth conversation on public facebook pages, which cannot trend as easily and is far less punchy and digestible. What role does each play in the political process and in constituting news?
Of course, my current research asks more questions than these, but it’s currently under construction. I’d rather not invite you into the workzone until some of the pulp and debris have been swept aside…