It’s always fun for a professional survey researcher to stumble upon a great pop cultural reference to a survey. Yesterday I heard a great description of a census taken at Kakuma refugee camp in Kenya. The description was in the book I’m currently reading: What Is the What by Dave Eggers (great book, I highly recommend it!). The book itself is fiction, loosely based on a true story, so this account likely stems from a combination of observation and imagination. The account reminds me of some of the field reports and ethnographic findings in other intercultural survey efforts, both national (US census) and inter or multinational.
To set the stage, Achak is the main character and narrator of the story. He is one of the “lost boys” of Sudan, and he found his way to Kakuma after a long and storied escape from his war-ravaged hometown. At Kakuma he was taken in by another Denka man, named Gop, who is acting as a kind of father to Achak.

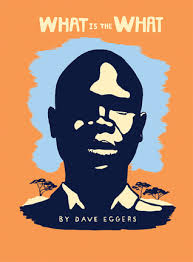
What is the What by Dave Eggers
“The announcement of the census was made while Gop was waiting for the coming of his wife and daughters, and this complicated his peace of mind. To serve us, to feed us, the UNHCR and Kakuma’s many aid groups needed to know how many refugees were at the camp. Thus, in 1994 they announced they would count us. It would only take a few days, they said. To the organizers I am sure it seemed a very simple, necessary, and uncontroversial directive. But for the Sudanese elders, it was anything but.
—What do you think they have planned? Gop Chol wondered aloud.
I didn’t know what he meant by this, but soon I understood what had him, and the majority of Sudanese elders, greatly concerned. Some learned elders were reminded of the colonial era, when Africans were made to bear badges of identification on their necks.
—Could this counting be a pretext of a new colonial period? Gop mused.—It’s very possible.
Probable even!
I said nothing.
At the same time, there were practical, less symbolic, reasons to oppose the census, including the fact that many elders imagined that it would decrease, not increase, our rations. If they discovered there were fewer of us than had been assumed, the food donations from the rest of the world would drop. The more pressing and widespread fear among young and old at Kakuma was that the census would be a way for the UN to kill us all. These fears were only exacerbated when the fences were erected.
The UN workers had begun to assemble barriers, six feet tall and arranged like hallways. The fences would ensure that we would walk single file on our way to be counted, and thus counted only once. Even those among us, the younger Sudanese primarily, who were not so worried until then, became gravely concerned when the fences went up. It was a malevolent-looking thing, that maze of fencing, orange and opaque. Soon even the best educated among us bought into the suspicion that this was a plan to eliminate the Dinka. Most of the Sudanese my age had learned of the Holocaust, and were convinced that this was a plan much like that used to eliminate the Jews in Germany and Poland. I was dubious of the growing paranoia, but Gop was a believer. As rational a man as he was, he had a long memory for injustices visited upon the people of Sudan.
—What isn’t possible, boy? he demanded.—See where we are? You tell me what isn’t possible at this time in Africa!
But I had no reason to distrust the UN. They had been feeding us at Kakuma for years. There was not enough food, but they were the ones providing for everyone, and thus it seemed nonsensical that they would kill us after all this time.
—Yes, he reasoned,—but see, perhaps now the food has run out. The food is gone, there’s no more money, and Khartoum has paid the UN to kill us. So the UN gets two things: they get to save food, and they are paid to get rid of us.
—But how will they get away with it?
—That’s easy, Achak. They say that we caught a disease only the Dinka can get. There are always illnesses unique to certain people, and this is what will happen. They’ll say there was a Dinka plague, and that all the Sudanese are dead. This is how they’ll justify killing every last one of us.
—That’s impossible, I said.
—Is it? he asked.—Was Rwanda impossible?
I still thought that Gop’s theory was unreliable, but I also knew that I should not forget that there were a great number of people who would be happy if the Dinka were dead. So for a few days, I did not make up my mind about the head count. Meanwhile, public sentiment was solidifying against our participation, especially when it was revealed that the fingers of all those counted, after being counted, would be dipped in ink.
—Why the ink? Gop asked. I didn’t know.
—The ink is a fail-safe measure to ensure the Sudanese will be exterminated.
I said nothing, and he elaborated. Surely if the UN did not kill us Dinka while in the lines, he theorized, they would kill us with this ink on the fingers. How could the ink be removed? It would, he thought, enter our bodies when we ate.
—This seems very much like what they did to the Jews, Gop said.
People spoke a lot about the Jews in those days, which was odd, considering that a short time before, most of the boys I knew thought the Jews were an extinct race. Before we learned about the Holocaust in school, in church we had been taught rather crudely that the Jews had aided in the killing of Jesus Christ. In those teachings, it was never intimated that the Jews were a people still inhabiting the earth. We thought of them as mythological creatures who did not exist outside the stories of the Bible. The night before the census, the entire series of fences, almost a mile long, was torn down. No one took responsibility, but many were quietly satisfied.
In the end, after countless meetings with the Kenyan leadership at the camp, the Sudanese elders were convinced that the head count was legitimate and was needed to provide better services to the refugees. The fences were rebuilt, and the census was conducted a few weeks later. But in a way, those who feared the census were correct, in that nothing very good came from it. After the count, there was less food, fewer services, even the departure of a few smaller programs. When they were done counting, the population of Kakuma had decreased by eight thousand people in one day.
How had the UNHCR miscounted our numbers before the census? The answer is called recycling.
Recycling was popular at Kakuma and is favored at most refugee camps, and any refugee anywhere in the world is familiar with the concept, even if they have a different name for it. The essence of the idea is that one can leave the camp and re-enter as a different person, thus keeping his first ration card and getting another when he enters again under a new name. This means that the recycler can eat twice as much as he did before, or, if he chooses to trade the extra rations, he can buy or otherwise obtain anything else he needs and is not being given by the UN—sugar, meat, vegetables. The trading resulting from extra ration cards provided the basis for a vast secondary economy at Kakuma, and kept thousands of refugees from anemia and related illnesses. At any given time, the administrators of Kakuma thought they were feeding eight thousand more people than they actually were. No one felt guilty about this small numerical deception.
The ration-card economy made commerce possible, and the ability of different groups to manipulate and thrive within the system led soon enough to a sort of social hierarchy at Kakuma.”