Digital Democracy Remixed

I recently transitioned from my study of the many reasons why the voice of DC taxi drivers is largely absent from online discussions into a study of the powerful voice of the Kenyan people in shaping their political narrative using social media. I discovered a few interesting things about digital democracy and social media research along the way, and the contrast between the groups was particularly useful.

Here are some key points:

  • The methods of sensemaking that journalists use in social media is similar to other methods of social media research, except for a few key factors, the most important of which is that the bar for verification is higher
  • The search for identifiable news sources is important to journalists and stands in contrast with research methods that are built on anonymity. This means that the input that journalists will ultimately use will be on a smaller scale than the automated analyses of large datasets widely used in social media research.
  • The ultimate information sources for journalists will be small, but the phenomena that will capture their attention will likely be big. Although journalists need to dig deep into information, something in the large expanse of social media conversation must capture or flag their initial attention
  • It takes some social media savvy to catch the attention of journalists. This social media savvy outweighs linguistic correctness in the ultimate process of getting noticed. Journalists act as intermediaries between social media participants and a larger public audience, and part of the intermediary process is language correcting.
  • Social media savvy is not just about being online. It is about participating in social media platforms in a publicly accessible way in regards to publicly relevant topics and using the patterned dialogic conventions of the platform on a scale that can ultimately draw attention. Many people and publics go online but do not do this.

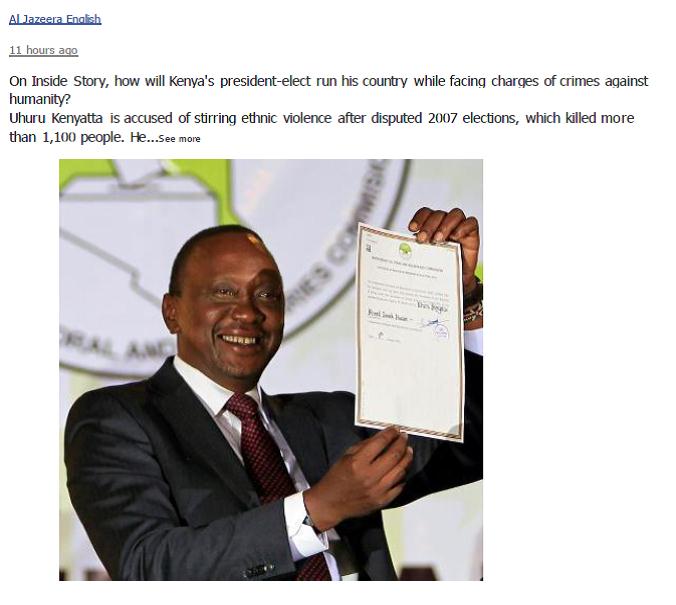
The analysis of social media data for this project was particularly interesting. My data source was the comments following this posting on the Al Jazeera English Facebook feed.

fb

It evolved quite organically. After a number of rounds of coding I noticed that I kept drawing diagrams in the margins of some of the comments. I combined the diagrams into this framework:

scales

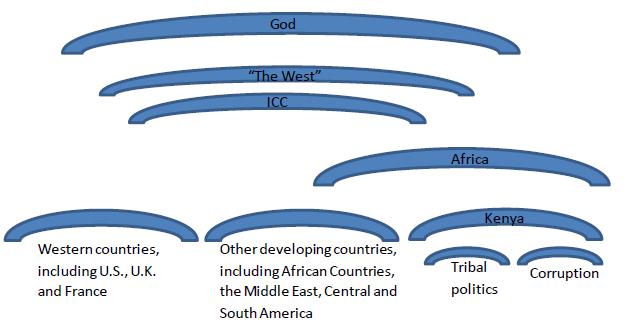
Once this framework was built, I looked closely at the ways in which participants used this framework. Sometimes participants made distinct discursive moves between these levels. But when I tried to map the participants’ movements on their individual diagrams, I noticed that my depictions of their movements rarely matched when I returned to a diagram. Although my coding of the framework was very reliable, my coding of the movements was not at all. This led me to notice that oftentimes the frames were being used more indexically. Participants were indexing levels of the frame, and this indexical process created powerful frame shifts. So, on the level of Kenyan politics exclusively, Uhuru’s crimes had one meaning. But juxtaposed against the crimes of other national leaders’ Uhuru’s crimes had a dramatically different meaning. Similarly, when the legitimacy of the ICC was questioned, the charges took on a dramatically different meaning. When Uhuru’s crimes were embedded in the postcolonial East vs West dynamic, they shrunk to the degree that the indictments seemed petty and hypocritical. And, ultimately, when religion was invoked the persecution of one man seemed wholly irrelevant and sacrilegious.

These powerful frame shifts enable the Kenyan public to have a powerful, narrative changing voice in social media. And their social media savvy enables them to gain the attention of media sources that amplify their voices and thus redefine their public narrative.

readyforcnn

Instagram is changing the way I see

I recently joined Instagram (I’m late, I know).

I joined because my daughter wanted to, because her friends had, to see what it was all about. She is artistic, and we like to talk about things like color combinations and camera angles, so Instagram is a good fit for us. But it’s quickly changing the way I understand photography. I’ve always been able to set up a good shot, and I’ve always had an eye for color. But I’ve never seriously followed up on any of it. It didn’t take long on Instagram to learn that an eye for framing and color is not enough to make for anything more than accidental great shots. The great shots that I see are the ones that pick deeper patterns or unexpected contrasts out of seemingly ordinary surroundings. They don’t simply capture beauty, they capture an unexpected natural order or a surprising contrast, or they tell a story. They make you gasp or they make you wonder. They share a vision, a moment, an insight. They’re like the beginning paragraph of a novel or the sketch outline of a poem. Realizing that, I have learned that capturing the obvious beauty around me is not enough. To find the good shots, I’ll need to leave my comfort zone, to feel or notice differently, to wonder what or who belongs in a space and what or who doesn’t, and why any of it would capture anyone’s interest. It’s not enough to see a door. I have to wonder what’s behind it. To my surprise, Instagram has taught me how to think like a writer again, how to find hidden narratives, how to feel contrast again.

Sure this makes for a pretty picture. But what is unexpected about it? Who belongs in this space? Who doesn't? What would catch your eye?

Sure this makes for a pretty picture. But what is unexpected about it? Who belongs in this space? Who doesn’t? What would catch your eye?

This kind of change has a great value, of course, for a social media researcher. The kinds of connections that people forge on social media, the different ways in which people use platforms and the ways in which platforms shape the way we interact with the world around us, both virtual and real, are vitally important elements in the research process. In order to create valid, useful research in social media, the methods and thinking of the researcher have to follow closely with the methods and thinking of the users. If your sensemaking process imitates the sensemaking process of the users, you know that you’re working in the right direction, but if you ignore the behaviors and goals of the users, you have likely missed the point altogether. (For example, if you think of Twitter hashtags simply as an organizational scheme, you’ve missed the strategic, ironic, insightful and often humorous ways in which people use hashtags. Or if you think that hashtags naturally fall into specific patterns, you’re missing their dialogic nature.)

My current research involves the cycle between social media and journalism, and it runs across platforms. I am asking questions like ‘what gets picked up by reporters and why?’ and ‘what is designed for reporters to pick up?’ And some of these questions lead me to examine the differences between funny memes that circulate like wildfire through Twitter leading to trends and a wider stage and the more indepth conversation on public facebook pages, which cannot trend as easily and is far less punchy and digestible. What role does each play in the political process and in constituting news?

Of course, my current research asks more questions than these, but it’s currently under construction. I’d rather not invite you into the workzone until some of the pulp and debris have been swept aside…

Still grappling with demographics

Last year I wrote about my changing perspective on demographic variables. My grappling has continued since then.
I think of it as an academic puberty of sorts.

I remember the many crazy thought exercises I subjected myself to as a teenager, as I tried to forge my own set of beliefs and my own place in the world. I questioned everything. At times I was under so much construction that it was a wonder I functioned at all. Thankfully, I survived to enter my twenties intact. But lately I have been caught in a similar thought exercise of sorts, second guessing the use of sociological demographic variables in research.

Two sample projects mark two sides of the argument. One is a potential study of the climate for underrepresented faculty members in physics departments. In our exploration of this subject, the meaning of underrepresented was raised. Indeed there are a number of ways in which a faculty member could be underrepresented or made uncomfortable: gender, race, ethnicity, accent, bodily differences or disabilities, sexual orientation, religion, … At some point, one could ask whether it matters which of these inspired prejudicial or different treatment, or whether the hostile climate is, in and of itself, important to note. Does it make sense to tick off which of a set of possible prejudices are stronger or weaker at a particular department? Or does it matter first that the uncomfortable climate exists, and that personal differences that should be professionally irrelevant are coming into professional play. One could argue that the climate should be the first phase of the study, and any demographics could be secondary. One might be particularly tempted to argue for this arrangement given the small sizes of the departments and hesitation among many faculty members to supply information that could identify them personally.

If that was the only project on my mind, I might be tempted to take a more deconstructionist view of demographic variables altogether. But there is another project that I’m working on that argues against the deconstructionist view- the Global Survey of Physicists.

(Side or backstory: The global survey is kind of a pet project of mine, and it was the project that led me to grad school. Working on it involved coordinating survey design, translation and dissemination with representatives from over 100 countries. This was our first translation project. It began in English and was then translated into 7 additional languages. The translation process took almost a full year and was full of unexpected complications. Near the end of this phase, I attended a talk at the Bureau of Labor Statistics by Yuling Pan from Census. The talk was entitled ‘the Sociolinguistics of Survey Translation.’ I attended it never having heard of Sociolinguistics before. During the course of the talk, Yuling detailed and dissected experiences that paralleled my own into useful pieces and diagnosed and described some of the challenges I had encountered in detail. I was so impressed with her talk that I googled Sociolinguistics as soon as I returned to my office, discovered the MLC a few minutes later. One month later I was visiting Georgetown and working on my application for the MLC. I like to say it was like being swept up off my feet and then engaging in a happy shotgun marriage)

The Global Survey was designed to elicit gender differences in terms of experiences, climate, resources and opportunities, as well as the effects of personal and family constraints and decisions on school and career. The survey worked particularly well, and each dive into the data proves fascinating. This week I delved deeper into the dynamics of one country and saw women’s sources of support erode as they progressed further into school and work, saw the women transition from a virtual parity in school to difficult careers, beginning with their significantly larger chance of having to choose their job because it was the only offer they received, and becoming significantly worse with the introduction of kids. In fact, we found through this survey that kids tend to slow women’s careers and accelerate men’s!

What do these findings say about the use of demographic variables? They certainly validate their usefulness and cause me to wonder whether a lack of focus on demographics would lessen the usefulness of the faculty study. Here I’m reminded that it is important, when discussing demographic variables, to keep in mind that they are not arbitrary. They reflect ways of seeing that are deeply engrained in society. Gender, for example, is the first thing to note about a baby, and it determines a great deal from that point in. Excluding race or ethnicity seems foolish, too, in a society that so deeply engrains these distinctions.

The problem may be in the a priori or unconsidered applications of demographic variables. All too often, the same tired set of variables are dredged up without first considering whether they would even provide a useful distinction or the most useful cuts to a dataset. A recent example of this is the study that garnered some press about racial differences in e-learning. From what I read of the study, all e-learning was collapsed into a single entity, an outcome or dependent variable (as in some kind if measure of success of e-learning), and run by a set of traditional x’s or independent variables, like race and socioeconomic status. In this case, I would have preferred to first see a deeper look into the mechanics of e-learning than a knee jerk rush to the demographic variables. What kind of e-learning course was it? What kinds of interaction were fostered between the students and the teacher, material and other students? So many experiences of e-learning were collapsed together, and differences in course types and learning environments make for more useful and actionable recommendations than demographics ever could.

In the case of the faculty and global surveys as well, one should ask what approaches to the data would yield the most useful analyses. Finding demographic differences leads to what- an awareness of discrimination? Discrimination is deep seeded and not easily cured. It is easy to document and difficult to fix. And yet, more specific information about climate, resources and opportunities could be more useful or actionable. It helps to ask what we can achieve through our research. Are we simply validating or proving known societal differences or are we working to create actionable recommendations? What are the most useful distinctions?

Most likely, if you take the time to carefully consider the information you collect, the usefulness of your analyses and the validity of your hypotheses, you are one step above anyone rotely applying demographic variables out of ill-considered habit. Kudos to you for that!

Total Survey Error: as Iconic as the Statue of Liberty herself?

In Jan Blommaerts book, the Sociolinguistics of Globalization, I learned about the iconicity of language. Languages, dialects, phrases and words have the potential to be as iconic as the statue of liberty. As I read Blommaert’s book, I am also reading about Total Survey Error, which I believe to be an iconic concept in the field of survey research.

Total Survey Error (TSE) is a relatively new, albeit very comprehensive framework for evaluating a host of potential error sources in survey research. It is often mentioned by AAPOR members (national and local), at JPSM classes and events, and across many other events, publications and classes for survey researchers. But here’s the catch: TSE came about after many of us entered the field. In fact, by the time TSE debuted and caught on as a conceptual framework, many people had already been working in the field for long enough that a framework didn’t seem necessary or applicable.

In the past, survey research was a field that people grew into. There were no degree or certificate programs in survey research. People entered the field from a variety of educational and professional backgrounds and worked their way up through the ranks from data entry, coder or interviewing positions to research assistant and analyst positions, and eventually up to management. Survey research was a field that valued experience, and much of the essential job knowledge came about through experience. This structure strongly characterizes my own office, where the average tenure is fast approaching two decades. The technical and procedural history of the department is alive and well in our collections of artifacts and shared stories. We do our work with ease, because we know the work well, and the team works together smoothly because of our extensive history together. Challenges or questions are an opportunity for remembering past experiences.

Programs such as the Joint Program in Survey Methodology (JPSM, a joint venture between the University of Michigan and University of Maryland) are relatively new, arising, for the most part, once many survey researchers were well established into their routines. Scholarly writings and journals multiplied with the rise of the academic programs. New terms and new methods sprang up. The field gained an alternate mode of entry.

In sociolinguistics, we study evidentiality, because people value different forms of evidence. Toward this end, I did a small study of survey researchers’ language use and mode of evidentials and discovered a very stark split between those that used experience to back up claims and those who relied on research to back up claims. This stark difference matched up well to my own experiences. In fact, when I coach jobseekers who are looking for survey research positions, I  draw on this distinction and recommend that they carefully listen to the types of evidentials they hear from the people interviewing them and try to provide evidence in the same format. The divide may not be visible from the outside of the field, but it is a strong underlying theme within it.

The divide is not immediately visible from the outside because the face of the field is formed by academic and professional institutions that readily embrace the academic terminology. The people who participate in these institutions and organizations tend to be long term participants who have been exposed to the new concepts through past events and efforts.

But I wonder sometimes whether the overwhelming public orientation to these methods doesn’t act to exclude some longtime survey researchers in some ways. I wonder whether some excellent knowledge and history get swept away with the new. I wonder whether institutions that represent survey research represent the field as a whole. I wonder what portion of the field is silent, unrepresented or less connected to collective resources and changes.

Particularly as the field encounters a new set of challenges, I wonder how well prepared the field will be- not just those who have been following these developments closely, but also those who have continued steadfast, strong, and with limited errors- not due to TSE adherence, but due to the strength of their experience. To me, the Total Survey Error Method is a powerful symbol of the changes afoot in the field.

For further reference, I’m including a past AAPOR presidential address by Robert Groves

groves aapor

Proceedings of the Fifty-First Annual Conference of the American Association for Public Opinion Research
Source: Source: The Public Opinion Quarterly, Vol. 60, No. 3 (Autumn, 1996), pp. 471-513
ETA other references:

Bob Groves: The Past, Present and Future of Total Survey Error

Slideshow summary of above article

Is there Interdisciplinary hope for Social Media Research?

I’ve been trying to wrap my head around social media research for a couple of years now. I don’t think it would be as hard to understand from any one academic or professional perspective, but, from an interdisciplinary standpoint, the variety of perspectives and the disconnects between them are stunning.

In the academic realm:

There is the computer science approach to social media research. From this standpoint, we see the fleshing out of machine learning algorithms in a stunning horserace of code development across a few programming languages. This is the most likely to be opaque, proprietary knowledge.

There is the NLP or linguistic approach, which overlaps to some degree with the cs approach, although it is often more closely tied to grammatical rules. In this case, we see grammatical parsers, dictionary development, and api’s or shared programming modules, such as NLTK or GATE. Linguistics is divided as a discipline, and many of these divisions have filtered into NLP.

Both the NLP and CS approaches can be fleshed out, trained, or used on just about any data set.

There are the discourse approaches. Discourse is an area of linguistics concerned with meaning above the level of the sentence. This type of research can follow more of a strict Conversation Analysis approach or a kind of Netnography approach. This school of thought is more concerned with context as a determiner or shaper of meaning than the two approaches above.

For these approaches, the dataset cannot just come from anywhere. The analyst should understand where the data came from.

One could divide these traditions by programming skills, but there are enough of us who do work on both sides that the distinction is superficial. Although, generally speaker, the deeper one’s programming or qualitative skills, the less likely one is to cross over to the other side.

There is also a growing tradition of data science, which is primarily quantitative. Although I have some statistical background and work with quantitative data sets every day, I don’t have a good understanding of data science as a discipline. I assume that the growing field of data visualization would fall into this camp.

In the professional realm:

There are many companies in horseraces to develop the best systems first. These companies use catchphrases like “big data” and “social media firehose” and often focus on sentiment analysis or topic analysis (usually topics are gleaned through keywords). These companies primarily market to the advertising industry and market researchers, often with inflated claims of accuracy, which are possible because of the opacity of their methods.

There is the realm of market research, which is quickly becoming dependent on fast, widely available knowledge. This knowledge is usually gleaned through companies involved in the horserace, without much awareness of the methodology. There is an increasing need for companies to be aware of their brand’s mentions and interactions online, in real time, and as they collect this information it is easy, convenient and cost effective to collect more information in the process, such as sentiment analyses and topic analyses. This field has created an astronomically high demand for big data analysis.

There is the traditional field of survey research. This field is methodical and error focused. Knowledge is created empirically and evaluated critically. Every aspect of the survey process is highly researched and understood in great depth, so new methods are greeted with a natural skepticism. Although they have traditionally been the anchors of good professional research methods and the leaders in the research field, survey researchers are largely outside of the big data rush. Survey researchers tend to value accuracy over timeliness, so the big, fast world of big data, with its dubious ability to create representative samples, hold little allure or relevance.

The wider picture

In the wider picture, we have discussions of access and use. We see a growing proportion of the population coming online on an ever greater variety of devices. On the surface, the digital divide is fast shrinking (albeit still significant). Some of the digital access debate has been expanded into an understanding of differential use- essentially that different people do different activities while online. I want to take this debate further by focusing on discursive access or the digital representation of language ideologies.

The problem

The problem with such a wide spread of methods, needs, focuses and analytic traditions is that there isn’t enough crossover. It is very difficult to find work that spreads across these domains. The audiences are different, the needs are different, the abilities are different, and the professional visions are dramatically different across traditions. Although many people are speaking, it seems like people are largely speaking within silos or echo chambers, and knowledge simply isn’t trickling across borders.

This problem has rapidly grown because the underlying professional industries have quickly calcified. Sentiment analysis is not the revolutionary answer to the text analysis problem, but it is good enough for now, and it is skyrocketing in use. Academia is moving too slow for the demands of industry and not addressing the needs of industry, so other analytic techniques are not being adopted.

Social media analysis would best be accomplished by a team of people, each with different training. But it is not developing that way. And that, I believe, is a big (and fast growing) problem.

Dispatch from the quantitative | qualitative border

On Tuesday evening I attended my first WAPA meeting (Washington Association of Professional Anthropologists). This group meets monthly, first with a happy hour and then with a speaker. Because I have more of a quantitative background, the work of professional anthropologists really blows my mind. The topics are wide ranging and the work interesting and innovative. I’ve been sorry to miss so many of their gatherings.

This week’s topic was near and dear to my heart in two ways.

1. The work was done in a survey context as a qualitative investigation preceding the development of survey questions. As a professional survey methodologist, I have worked through the surprisingly complicated question writing process many hundreds of times, so this approach really fascinates me!

2. The work surrounded the topic of childbirth. As a mother of two and a [partially] trained birth assistant, I love to talk about childbirth.

The purpose of the study at hand was to explore infant mortality in greater depth by investigating certain aspects of the delivery process. The topics of interest included:

– whether the birth was attended by a professional or not
– whether the birth was at home or in a medical facility
– delivery of the placenta
– how soon after the birth the baby was wiped
– cord cutting and tying
– whether the baby was swaddled and whether the baby’s head was covered
– how soon the baby was bathed

The study was based on 80 respondents (half facility births, half homebirths) (half moms of newborns, half moms of 1-2 year olds) from each of two countries. The researchers collected two kinds of data: extensive unstructured interviews and survey questions. The interviews were coded using Atlas ti into specific, identifiable, repeated events that were relevant to infant mortality and then placed onto a timeline. The timeline guided the recommended order of the survey questions.

One audience member shared that she would have collected stories of “what is a normal childbirth?” from participants in addition to the women’s personal stories. Her focus with this tactic was to collect the language with which people usually discuss these events in childbirth. She mentioned that her field was linguistic anthropology. The language she was talking about is referred to by survey researchers as “native terms-” essentially the terms that people normally use when discussing a given topic. One of the goals of question writing is to write a question using the terms that a respondent would naturally use to classify their response, making the response process easier for the respondent and collecting higher quality data. The presenters mentioned that, although they did not collect normative stories, collecting native terms was a part of their research process and recommendations.

The topics of focus are problematic ones to investigate. Most women can tell whether or not they gave birth in a facility and whether or not the birth was attended by a professional. Women can usually remember their labor and delivery in detail (usually for the rest of their lives), as well as the first time they held and fed their babies. Often women can also remember the delivery of the placenta or whether or not they hemorrhaged or tore significantly during the birth process.

But other aspects of the birth, such as the cord cutting and tying and the first wiping and swaddling of the baby, are usually done by someone other than the mother (if there is someone else present). They often don’t command the attention of the mother, who is full of emotion and adrenaline and catching her breath from an all encompassing, life changingly powerful experience. These moments are often not as memorable as others, and the mothers are often not as fully aware of them or able to report them.

I wondered if the moms were able to use the same level of detail in retelling these parts of their stories? Was there any indication that these sections of the stories they told were their own personal stories and not a general recounting of events as they are supposed to happen? In survey research, we talk about satisficing, or providing an answer because an answer is expected, not because it is correct. In societies where babies are frequently born at home, people often grow up around childbirth and know the general, expected order of events. How would the results of the study have been different if the researchers had used a slightly different approach: instead of assuming that the mothers would be able to recount all of these details of their own experiences, the researchers could have taken a deeper look at who performed the target activities, how detailed an account of the activities the mothers were able to provide, and the nature of the mom’s involvement or role in the target activities.

I wondered if working with this alternative approach would have led to questions more like “The next few questions refer to the moments after your baby was born and the first time you held and nursed your baby. Was the baby already wiped when you first held and nursed them? Was the babies cord already cut and tied? Was the baby already swaddled? Was the baby’s head already covered?” Although questions like these wouldn’t separate out the first 5 minutes from the first 10, they would likely be easier for the mom to answer and yield more complete and accurate responses.

All in all, this event was a fantastic one. I learned about an area of research that I hadn’t known existed. The speaker was great, and the audience was engaged. If you have an opportunity to attend a WAPA event, I highly recommend it.

Storytelling about correlation and causation

Many researchers have great war stories to tell about the perilous waters between correlation and causation. Here is my personal favorite:

In the late 90’s, I was working with neurosurgery patients in a medical psychology clinic in a hospital. We gave each of the patients a battery of cognitive tests before their surgery and then administered the same battery 6 months after the surgery. Our goal was to check for cognitive changes that may have resulted from the surgery. One researcher from outside the clinic focused on our strongest finding: a significant reduction of anxiety from pre-op to post-op. She hypothesized that this dramatic finding was evidence that the neural basis for anxiety was affected by the surgery. Had she only taken a minute to explain her  hypothesis in plain terms to a layperson, especially one that could imagine the anxiety a patient could potentially experience hours before brain surgery, she surely would have withdrawn her request for our data and slipped quietly out of our clinic.

“Correlation does not imply causation” is a research catchphrase that is drilled into practitioners from internhood and intro classes onward. It is particularly true when working with language, because all linguistic behavior is highly patterned behavior. Researchers from many other disciplines would kill to have chi square tests as strong as linguists’ chi squares. In fact, linguists have to reach deeper into their statistical toolkits, because the significance levels alone can be misleading or inadequate.

People who use language but don’t study linguistics usually aren’t aware of the degree of patterning that underlies the communication process. Language learning has statistical underpinnings, and language use has statistical underpinnings. It is because of this patterning that linguistic machine learning is possible. But, linguistic patterning is a double edged sword- potentially helpful in programming and harmful in analysis. Correlations abound, and they’re mostly real correlations, although, statistically speaking, some will be products of peculiarities in a dataset. But outside of any context or theory, these findings are meaningless. They don’t speak to the underlying relationship between the variables in any way.

A word of caution to researchers whose work centers around the discovery of correlations. Be careful with your findings. You may have found evidence that shows that a correlation may exist. But that is all you have found. Take your next steps carefully. First, step back and think about your work in layman’s terms. What did you find, and is that really anything meaningful? If your findings still show some prospects, double down further and dig deeper. Try to get some better idea of what is happening. Get some context.

Because a correlation alone is no gold nugget. You may think you’ve found some fashion, but your emperor could very well still be naked.

Time for some Research Zen

As the new semester kicks into gear and work deadlines loom, I find myself ready for a moment of research zen.

2012-12-16 14.18.00

Let’s take a minute to stand in a stream and think about the water. Feel the flow of the water over your feet and by your calves. Feel the pull of constant motion. Feel yourself sink against the current, rooting deeper to keep steady. Breathe the clean outdoor air. Observe the clouds and watch the way the sky reflects in the water in the stream. The stream is not constant. The water passing now is not the water that passed when you started, and the water that passes when you leave will be still different. And yet we call this a stream.

As I observe sources of social media, thinking about sampling, I’m faced with some of the same questions that the stream gives rise to. Although I would define my sources consistently from day to day, their content shifts constantly. The stream is not constant, but rather constantly forming and reforming at my feet.

For a moment, I saw the tide of social media start to turn in favor of taxi drivers. In that moment, I felt both a strong sense of relief from the negativity and a need to revisit my research methods. Today I see that the stream has again turned against the drivers. I could ignore the momentary shift, or I could use this as a moment to again revisit the wisdom of sampling.

If I sample the river at a given point, what should I collect and what does it represent? How, when the water is constantly moving around me, can I represent what I observe within a sample? Could my sampling ever represent a single point in the stream, the stream as a whole, or streams in general? Or will it always be moments in the life of a stream?

In the words of Henry Miller, “The world is not to be put in order. The world is in order. It is for us to put ourselves in unison with this order.” In order to understand this stream, I need to understand what lies beneath it, what gives it its shape and flow, and how it works within its ecosystem.

The ecosystem of public opinion around the taxi system in DC is not one that can be understood purely online. When I see the reflection of clouds on the stream, I need to find the sky. When I see phrases repeated over and over, I need to understand where they come from and how they came to be repeated. In the words of Blaise Pascal “contradiction is not a sign of falsity, nor the lack of contradiction a sign of truth.” No elements in this ecosystem exist independent of context. Each element has its base.

Good research involves a good deal of reflection. It involves digging in against currents and close observation. It involves finding a moment of stillness in the flow of the stream.

Breathe in. Observe carefully. Breathe out. Repeat, continue, focus, research.

Fertile soil from dry dirt. Thank you, Netherlands!

The mood workshop (microanalysis of online data) in Nijmegen last week was immensely helpful for me. In two short days, my research lost some branches and grew some deeper roots. Definitely worth 21+ hours of travel!

Aerial shot of Greenland. Can't tell where the clouds end and the snow and ice begin!

Aerial shot of Greenland. Can’t tell where the clouds end and the snow and ice begin!

The retooling began early on the first day. My first, burning question for the group was about choosing representative data. The shocking first answer: why? To someone with a quantitative background, this question was mind blowing. The sky is up, the ground is down, and data should be representative. But representative of what?

Here we return to the nature of the data. What data are you looking at? What kind of motivated behavior does it represent? Essentially, I am looking at online conversation. We know that counting conversational topics is fruitless- that’s the first truth of conversation analysis. And we know that counting conversational participation is usually misguided. So what was I trying to represent?

My goal is to track a silence that happens across site types, largely independent of stimulus. No matter what kind of news article about taxis in Washington DC, no matter the source, the driver perspective is almost completely absent, and if it is represented the responses are noticeably different or marked. I had thought that if I could find a way to count this underrepresentation I could launch a systematic, grounded critique of the notion of participatory media and pose the question of which values were being maintained from the ground up. What is social capital in online news discourse, who speaks, and which speakers are ratified?

But this is not a question of representative sampling alone. Although sampling could offer a sense of context to the data, the meat and potatoes of the analysis are in fact fodder for conversation analysis. A more useful and interesting research question emerged: how are these online conversations constructed so as to make a pro taxi response dispreferred or marked? This question invokes pronoun usage, intertextuality, conversational reach, crowd based sanctioning, conversational structure and pair parts, register, and more. It provides grounding for a rich, layered analysis. Fertile soil from dry dirt. Thank you, Netherlands.

Canal in Amsterdam (note: the workshop was in Nijmegen, not Amsterdam. Also note: the dangers of parallel parking next to a canal. You'd be safer living in one of these houseboats!

Canal in Amsterdam (note: the workshop was in Nijmegen, not Amsterdam. Also note: the dangers of parallel parking next to a canal. You’d be safer living in one of these houseboats!

Turns out Ethnography happens one slice at a time

Some of you may have noticed that I promised to report some research and then didn’t.

Last semester, for my Ethnography of Communication class, I did an Ethnography of DC taxi drivers. The theme of the Ethnography was “the voice of the drivers.” It was multilayered, and it involved data from a great variety of sources. I had hoped to share my final paper for the class here, but that won’t work for three reasons.

1.) The nature of Ethnography. Ethnography involves collecting a great deal of data and then choosing what to report, in what way, and in what context. The goal of the final paper was to reflect on the methodology. This was an important exercise, but I really wanted to share more of my findings and less of my methodology here.

2.) The particular aspect of my findings that I most want to share here has to do with online discourse. Specifically, I want to examine the lack of representation of the drivers perspective online. There are quite a few different ways to accomplish this. I have tried to do it a number of ways, using different slices of data and using different analytic strategies. But I haven’t decided which is the best set of data or method of analysis. But I am a very lucky researcher. Next week I’m headed to a workshop at Radbound University in Nijmegen, Netherlands. The workshop is on the Microanalysis of Online Discourse. I am eager to bring my data and methodological questions and to recieve insight from such an amazing array of researchers. I am also very eager to see what they bring!

Much of the discussion in the analysis of online discourse either excludes the issue of representation altogether or focuses on it entirely. Social media is often hailed as the great democratizer of communication. Internet access was long seen as the biggest obstacle to this new democracy . From this starting point, much of the research has evolved to consider more of nuances of differential use, including the complicated nature of internet access as well as behavior and goals of internet users. This part of my findings is an example of differential use and of different styles of participation. Working with this data has changed the way I see social media and the way I understand the democratization of news.

3.) Scope. The other major reason why I haven’t shared my findings is because of the sheer scope of this project. I was fortunate enough to only have taken one class last semester, which left me the freedom to work much harder on it. Also, as a working/student mom, I chose a project that involved my whole family in an auto-ethnographic way, so much of my work brought me closer to my family, rather than farther apart (spending time away from family to study is one of the hardest parts of working student motherhood!)

I have amassed quite a bit of data at this point, and I plan to write a few different papers using it.

Stay tuned, because I will release slices of it. But have some patience, because each slice will only be released in its own good time.


At this point, I feel the need to reference the Hutzler Banana Slicer

Turns out, Ethnography is more like this:


than like this: