A dispatch from a quantitative side of social media research!
Here are a few of my reflections from the Social Media & Society conference in Halifax and my Social Network Analysis class.
I should first mention that I was lucky in two ways.
- I finished the James Bond movie ‘Skyfall’ as my last Air Canada flight was landing. (Ok, I didn’t have to mention that)
- I finished my online course on Social Network Analysis hours before leaving for a conference that kicked off with an excellent talk about Networks and diffusion. And then on the second day of the conference I was able to manipulate a network visualization with my hands using a 96 inch touchscreen at the Dalhousie University Social Media Lab (Great lab, by the way, with some very interesting and freely available tools)

This picture doesn’t do this screen justice. This is *data heaven*
Social networks are networks built to describe human action in social media environments. They contain nodes (dots), which could represent people, usernames, objects, etc. and edges, lines joining nodes that represent some kind of relationship (friend, follower, contact, or a host of other quantitative measures). The course was a particularly great introduction to Social Network Analysis, because it included a book that was clear and interesting, a set of youtube videos and a website, all of which were built to work together. The instructor (Dr Jen Golbeck, also the author of the book and materials) has a very unique interest in SNA which gives the class an important added dimension. Her focus is on operational definitions and quantitative measures of trust, and because of this we were taught to carefully consider the role of the edges and edge weights in our networks.
Sharad Goel’s plenary at #SMSociety13 was a very different look at networks. He questioned the common notion of viral diffusion online by looking at millions of cases of diffusion. He discovered that very few diffusions actual resemble any kind of viral model. Instead, most diffusion happens on a very small scale. He used Justin Bieber as an example of diffusion. Bieber has the largest number of followers on Twitter, so when it he posts something it has a very wide reach (“the Bieber effect”). However, people don’t share content as often as we imagine. In fact, only a very small proportion of his followers share it, and only a small proportion of their followers share it. Overall, the path is wide and shallow, with less vertical layers than we had previously envisioned.
Goel’s research is an example of Big Data in action. He said that Big Data methods are important when the phenomenon you want to study happens very infrequently (e.g. one in a million), as is the case for actual instances of viral diffusion.
His conclusions were big, and this line of research is very informative and useful for anyone trying to communicate on a large scale.
Sidenote: the term ‘ego network’ came up quite a few times during the conference, but not everyone knew what an ego network is. An ego network begins with a single node and is measured by degrees. A one degree social network looks a bit like an asterisk- it simply shows all of the nodes that are directly connected to the original node. A 1.5 degree network would include the first degree connections as well as the connections between them. A two degree network contains all of the first degree connections to these nodes that were in the one degree network. And so on.
One common research strategy is to compare across ego networks.
My next post will move on from SNA to more qualitative aspects of the conference
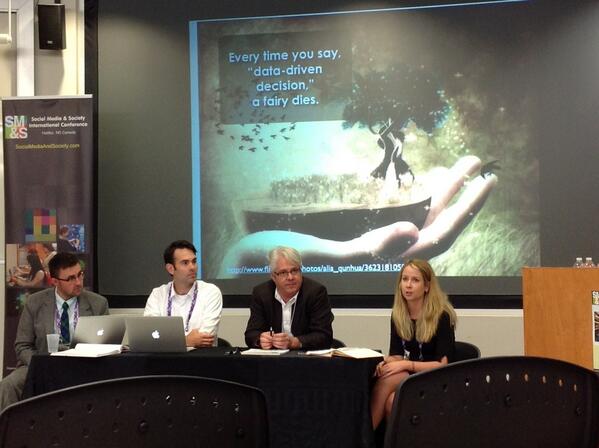
Source: https://twitter.com/JeffreyKeefer/status/378921564281921537/photo/1
This was the backdrop for a qualitative panel. It says “Every time you say ‘data driven decision’ a fairy dies.